Lab 3
Objectives
By the end of the lab, you will have:
- Gain some more practice working with recursive functions
- Do a little drawing with the turtle
- Learn about fractals
Working with the turtle
Python includes a module called turtle, which allows us to draw some simple graphics. The turtle can draw wherever it walks. So, we issue commands to tell the turtle where to go, and a drawing appears as it moves. Some of the most important commands are listed in the table below (more can be found in the online documentation). Give the table a quick look before you move on.
| Command | Description |
|---|---|
forward(distance) |
Move the turtle forward by the specified distance in the direction it is facing. |
backward(distance) |
Move the turtle backwards by the specified distance in the opposite direction to where it is facing. |
right(angle) |
Turn the turtle to its right by the specified angle. Note that this can be any angle |
left(angle) |
Turn the turtle to its left by the specified angle. |
goto(x, y) |
This drives the turtle immediately to the specified location without changing its orientation. |
down() |
Put the pen down so that the movement of the turtle leaves a track. |
up() |
Pick the pen up so that there are no tracks when the turtle moves. |
pencolor(colorstring) |
Change the color of the pen that the turtle is using. This can be a string such as ‘red’, ‘yellow’, ‘blue’, etc. Of course, you have to pick a valid color name. |
tracer(state) |
Turn on or off watching the turtle trace out the shapes. This is useful when you are trying to draw complex shapes and don’t want to wait. Pass in either True or False to turn the tracing on or off. |
update() |
If you turn off tracing, you can use this function to get everything the turtle has drawn so far to appear. |
window_width() |
Returns the current width of the turtle window. |
window_height() |
Returns the current height of the current turtle window. |
Remember that to use a module/library in python, you need to import it by using the import command (e.g. import turtle). Note that all of these must be prefaced with turtle.
The turtle module provides significant flexibility, defining multiple functions that do the same thing. The autograder expects that you will use the functions listed in the table above, rather than any equivalent functions that you can find in the online turtle documentation. Please limit yourself to these functions in your solution.
Part 0: Setup
To begin, download the file lab03.zip by clicking the blue “Download Starter Files” button at the top of the lab, and extract the files from the zip file into a directory called lab03 inside your labs directory.
Part 1: The Koch curve
You are going to write a function called draw_koch(length, generations) that draws a fractal shape called the Koch Curve. The Koch curve is a fractal – a shape that is self-similar, that is to say that it can be decomposed into smaller versions of essentially the same shape (hmmm… sounds recursivy…). The function is defined as follows; the rest of this section describes how to complete the function.
draw_koch
|
|||||
|---|---|---|---|---|---|
| Parameters |
|
||||
| Returns |
None
|
||||
Many of the techniques that we use to generate fractals computationally rely on the repetition of a set of steps, so we tend to talk about generations, which are the number of iterations that we used to produce the drawing. The Koch curve is a nice one since we can see its structure most clearly, by looking at how it changes from one generation to the next.
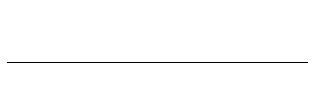
The starting place (generation 0) is a straight segment.
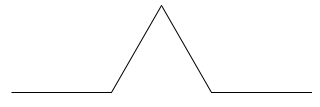
For the first generation, we cut the line into thirds and replace the middle segment with two segments of the same length, forming two sides of an equilateral triangle.
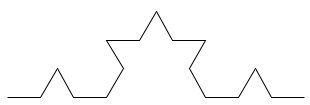
The second generation is formed by applying this same process to every segment in the previous generation (generation 1).
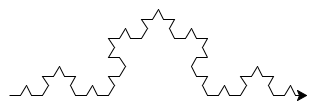
Further generations are formed by repeating this process, taking each segment, breaking it into thirds and replacing the middle segment with a bump. Conceptually, if you take this out to infinity, you will have a very curious mathematical phenomenon – an infinitely long line between two fixed points at a finite distance away. In practical terms, however, when the length of the individual lines becomes 1 pixel long, that is pretty much as small as we can get on a digital screen…
To actually draw the shape, the turtle will do the opposite of what we described above. We don’t want to draw a segment and then go back and remove a piece (nor would that be trivial once we have drawn it). Instead, we will jump right to drawing the highest generation of the fractal.
If you look at a generation 2 curve, it is made up of four generation 1 curves, each 1/3 the length of the generation 2 curve (go back to the images. Can you see it?)
Each of those generation 1 curves is made up of four generation 0 curves, each 1/3 of the length of the generation 1 curve. (Again, go back to the figures and convince yourself!)
What that means is that we don’t actually directly draw any of the higher generation curves, but we tell each generation to leverage the previous generations. The only thing is going to be actually drawn is a whole bunch of generation 0 curves (straight lines!) in different locations and directions.
Let’s see how!
Writing the function
Step one: Open the
lab03.pyscript in Thonny, if you haven’t already. There is some boilerplate in thedraw_koch_scenefunction that just moves the turtle over to the left a little to give us some more room. Don’t worry too much about it – you can pick it apart later. The only really important thing in there is that call to thedraw_koch()function (that you will write next).Step two: Start writing the
draw_koch()function above thedraw_koch_scene()function (Python reads from the top down and, if it doesn’t see a function when you call it, it is going to complain). Define the function and make sure it takes integer argumentslengthandgenerations. Don’t forget your docstring! We will be drawing this shape using (surprise!) a recursive function. Before you continue, make sure that you can calldraw_koch_scenein the shell without any errors. If there are errors, fix them! You may see warnings in the console about “Secure coding” – you can safely ignore thatStep three: Write the base case. When
generationsis 0, draw a straight line of lengthlength(it doesn’t matter which way the turtle is facing, we just go forward).Step four: Save and test this by calling
draw_koch_scenein the shell. It should draw a line that is 200 pixels long.Step five: We are going to start working on the recursive case, but it won’t be recursive yet. When
generationsis greater than 0, draw a first generation curve. We want the curve to fit withinlengthpixels. So, move forwardlength / 3pixels. Turn left by 60 degrees. Move forwardlength / 3pixels (putting you at the apex of the triangle). Turn right (by how much?) and draw the second side of the triangle. Turn left again (by how much?) and draw the final base line. You should now have a generation 1 curve that fits on a lengthlengthline.Step six: Save and test this by calling
draw_koch_scenein the shell. Make sure that when you change the number of generations indraw_koch_scene()so that you get one generation one curve.Step seven: Time to go recursive. Instead of drawing straight lines in the recursive case, each call to
turtle.forward()should be replaced with a call that draws a Koch curve of the same length (i.e., one thirdlength), and one generation less.Step eight: Test this by entering some different generations into the call in
draw_koch_scene(). We recommend starting small with something like a length of 200 and 1 generation just to make sure your code is working. Then you can work up to bigger curves and higher generations. IMPORTANT: Keep the number of generations low or you will be waiting FOREVER for it to finish. if you want to try higher generations, you should turn off the turtle tracer (the tracer is what animates the drawing process on the screen. With it off, you just get the final picture). You can do that by putting the lineturtle.tracer(False)before it the call to thedraw_koch()function and the lineturtle.update()when you have something you want to display (i.e., beforeturtle.done()). A second problem you may encounter is if the length gets to be less than 1 before you hit the base case, the line segments drawn by the base case will all have a length of 0, and the curve will not draw at all.
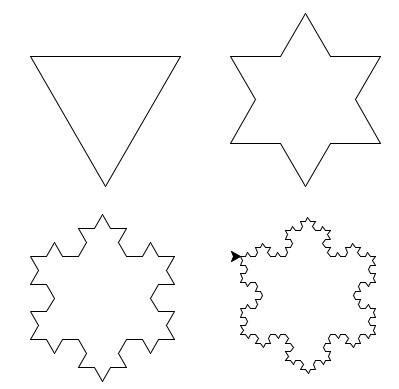
Part 2: The Koch Snowflake
If you draw three Koch curves corresponding to the three sides of an equilateral triangle, you will get a shape called the Koch snowflake.
Write a function called draw_snowflake(length, generations), which calls the draw_koch() function turns right 120 degrees, calls it again, turns 120 degrees, and then calls it again.
draw_snowflake
|
|||||
|---|---|---|---|---|---|
| Parameters |
|
||||
| Returns |
None
|
||||
Write a second scene function called draw_snowflake_scene(). You can start by copying draw_koch_scene().
Within this function you should draw at least three snowflakes. Each one should be unique with respect to size, spikiness (i.e., number of generations), and color (Color? Yes, color. See the list of turtle functions above). There should also be no connections between them (in other words, you need to use up() and down() and some movement functions between each call to the draw_snowflake() function).
draw_snowflake_scene
|
|
|---|---|
| Parameters | |
| Returns |
None
|
The file you hand in should not call any functions when it is run. So, if you open your file and push “play”, you should see nothing. However, if you call draw_snowflake_scene() in the shell, you will see your snowflakes!
Turning in your work
One you are done, submit lab03.py to gradescope and ensure that you have passed all of the tests. Your file should contain four functions: draw_koch(), draw_koch_scene(), draw_snowflake(), and draw_snowflake_scene().