Manual Linear Prediction
Part A: Classification
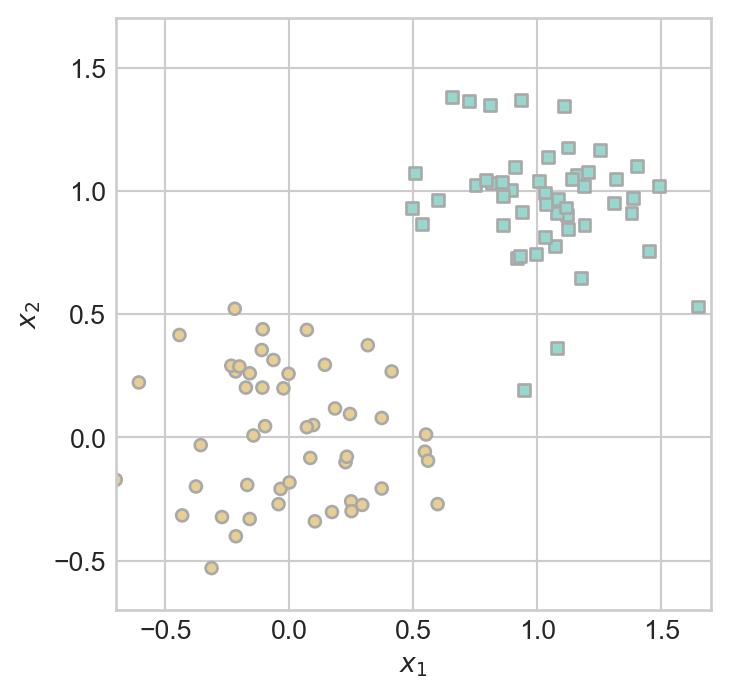
Consider the following set of data, which is divided into two classes represented by color and shape:
We want solve a classification problem, in which we use the location of the data points in \((x_1, x_2)\) space to predict their categories.
- Draw a line that separates the two classes, in the sense that every brown circle is on one side of the line and every teal square is on the other side of the line.
- Then, write down the equation of the line you drew, in the form \(w_1x_1 + w_2x_2 = t\). Your task here is to determine good values of the constants \(w_1\), \(w_2\), and \(t\).
- Suppose that you were given a new data point with coordinates \((x_1,x_2)\). Write pseudocode for a function that uses these inputs (and your values of \(w_1\), \(w_2\), and \(t\)) to predict the category of the new data point.
- Would you reasonably expect your prediction from your algorithm to ever be exactly right?
Part B: Regression
Consider the data below.
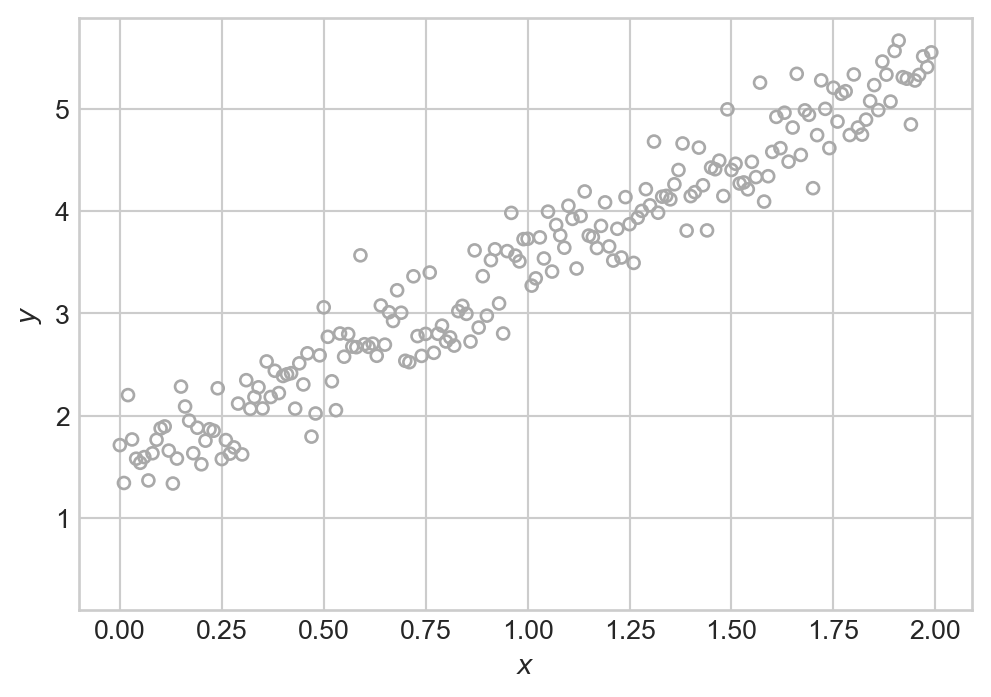
In this case, we want to solve a regression problem: our aim is to predict the value of \(y\) given a value of \(x\).
- Draw a line that “fits” the data, in the sense that it roughly describes the trend you see.
- Write down the equation of the line you drew, in the form \(w_1x + w_0 = y\). Your task here is to determine good values of the constants \(w_1\) and \(w_0\).
- Suppose that you were given a new value of \(x\). Write pseudocode for a function that uses this input (and your values of \(w_1\) and \(w_0\)) to predict the value of \(y\).
- Would you reasonably expect your prediction from your algorithm to ever be exactly right?
© Phil Chodrow, 2025